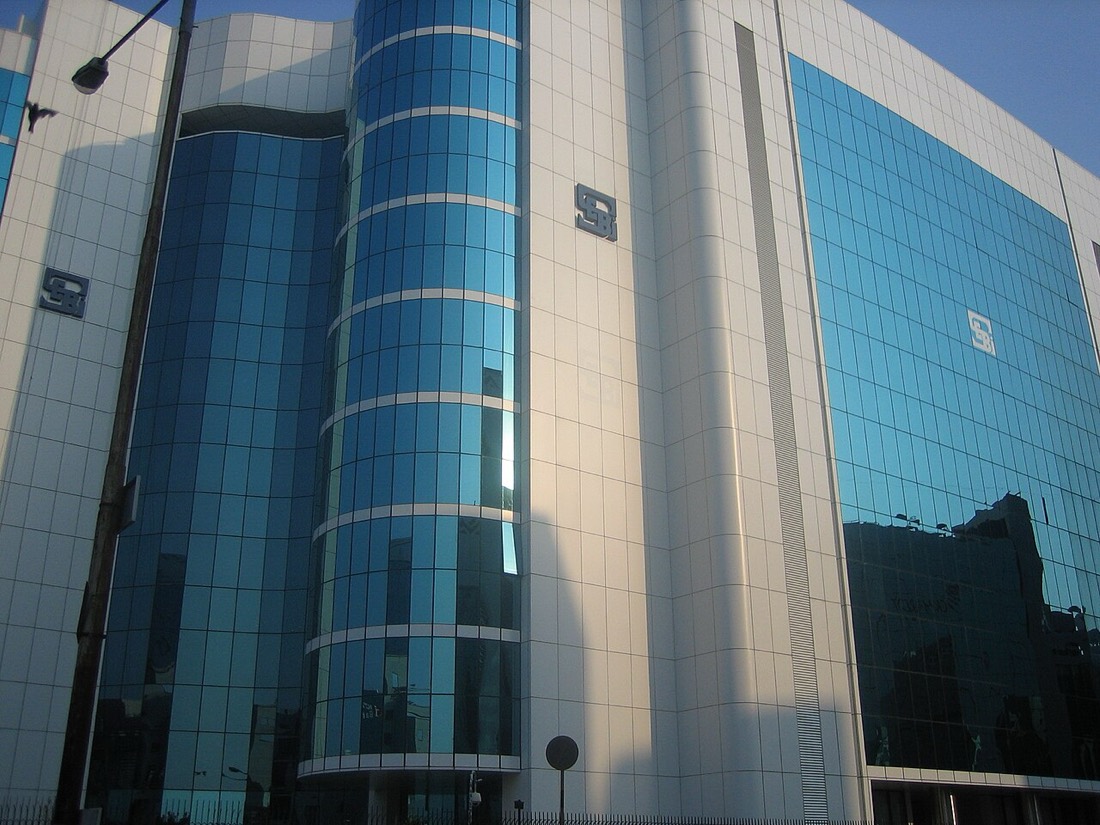
A SEBI study covering FY22 to FY24 found that 93 percent of individual traders in India's equity F&O segment lost money, a combined Rs 1.8 lakh crore across roughly one crore traders. The top 3.5 percent of loss-makers, around 4 lakh people, lost an average of Rs 28 lakh each. Somewhere in that pile of red numbers, a lot of traders were staring at open interest and put-call ratio data on their broker's app, convinced it was telling them something it was not.
Open interest (OI) and put-call ratio (PCR) are two of the most widely quoted numbers in Indian options trading, and also two of the most widely misread. Getting the definitions right takes five minutes. Getting the read right, especially at the extremes, is where a large share of that Rs 1.8 lakh crore likely went missing. If calls and puts themselves are new to you, start with call vs put options explained.
What open interest is actually counting
Open interest is the number of futures or options contracts still open, positions created but not yet closed out. It only rises when a genuinely new buyer and seller both open fresh positions, unlike trading volume, which counts every transaction including ones that just close an existing position. Reading OI alongside price direction beats reading it alone: rising OI on a rising price means fresh longs are entering with real backing, rising OI on a falling price means fresh shorts are piling in, falling OI on a rising price usually means shorts covering, and falling OI on a falling price usually means longs unwinding and walking away.
What PCR is, in plain terms
PCR is the ratio of put open interest to call open interest. A PCR below roughly 0.7 to 0.8 signals the crowd is skewed toward calls, generally read as bullish, while a PCR above roughly 1.3 to 1.5 signals a skew toward puts, read as bearish or defensive. In between, the market is considered close to balanced. NSE publishes this for the Nifty and Bank Nifty through the trading day, and most broking apps show it live in the option chain.
The trap: extremes don't mean what they look like
PCR measures where the crowd is already positioned, not where the market is going next. A very low PCR does not mean more upside is coming, it means a lot of people already bought that view, which is precisely the condition under which a small disappointment forces a rush of unwinding. A very high PCR does not automatically mean panic either, since institutions frequently sell puts near a level they consider solid support, and that put-writing raises PCR the same way retail fear does. The number looks identical either way. What it means depends on who is on the other side of it, and a raw PCR reading alone cannot tell you that.
Expiry day is where this trap bites hardest. OI and PCR swing hardest in the final sessions before expiry, and a reading that looks extreme on expiry morning can reverse entirely by afternoon as option writers defend their strikes, which is a recognisable pattern behind a lot of the losses in SEBI's data.
Where the regulator stepped in
SEBI's response arrived in October 2024, raising the minimum contract value for index derivatives to Rs 15-20 lakh from the earlier Rs 5-10 lakh band, and limiting exchanges to weekly expiry contracts on just one benchmark index, effective 20 November 2024. The intent was explicit: fewer, less frantic expiry cycles for retail traders chasing this exact kind of short-term OI and PCR swing. The FY26 numbers suggest it worked at the margin, with fewer participants and smaller losses, but nearly nine in ten still ended the year in the red, and Budget 2026's higher securities transaction tax made every round trip costlier from April.
Read it alongside FII flow, not instead of it
OI and PCR describe retail and proprietary positioning far more than what large, informed money is doing. Pairing an extreme PCR reading with the day's FII cash market activity tells you more than either number alone, since a bearish spike on a day FIIs are net buyers is a very different setup from the same spike on a day they are dumping index futures too. The same logic extends to sectors: a sudden OI build-up in one sector's futures is often an early tell of a sector rotation before it shows in the spot price, and a one-sided PCR extreme tends to show up on the same days the market is closest to tripping a circuit breaker.
None of this makes OI or PCR useless. It makes them what they actually are: a live readout of how crowded a trade has become, not a forecast. The traders who lost the most in SEBI's data were rarely the ones who ignored this data. They trusted it too literally, at exactly the moment it was measuring a crowd rather than predicting an outcome.