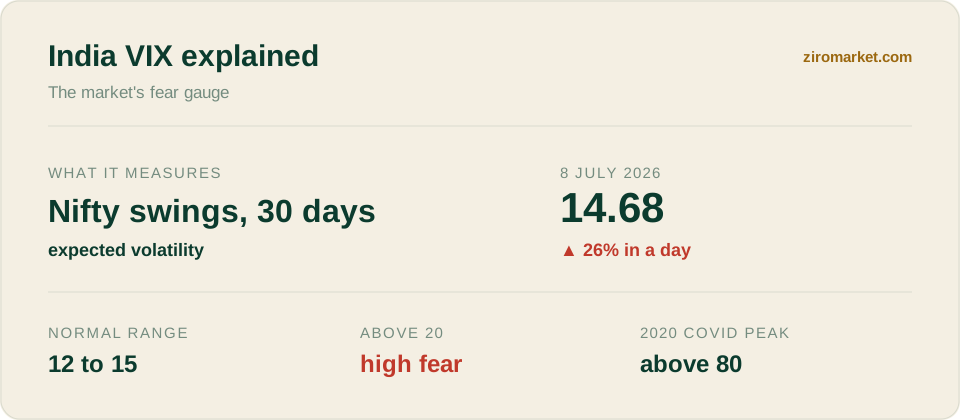
Every time the market crashes, one number suddenly starts trending: the India VIX. It did exactly that this week. On July 8, 2026, the India VIX jumped 26% in a single day to 14.68, its sharpest rise in months, as the Sensex crashed 1,677 points on the US-Iran conflict and an oil spike. So what is this "fear gauge," and what is it really telling you when it leaps like that?
In one line: the India VIX measures how big a ride the market expects over the next 30 days, not which direction it will go. It is a forecast of turbulence, not of gains or losses.
What the number means
The India VIX, launched by the NSE in 2008, is built from the prices of Nifty 50 options. When investors grow nervous, they pay up for options as protection, and those richer option prices push the VIX higher, which is why it climbs when fear spreads and falls when the market is calm. It is expressed as an annualised percentage of expected volatility. The contracts it is built from are explained in call vs put options.
A quick way to turn the number into something usable: divide it by roughly 19, the square root of about 365 days, to get the expected daily move. A VIX of 11.24 implies the market expects the Nifty to move about 0.6% on a typical day, while a VIX of 20 implies about 1%.
Crucially, it says nothing about direction. A high VIX means the market expects large moves, up or down, while a low VIX means it expects small ones. That is why it tends to spike on crashes, when uncertainty is highest, and drift lower during quiet, grinding rallies.
Reading the levels
The number only means something once you know the ranges. Here is a rough map of what different India VIX levels signal.
The surprising part of the July 2026 spike is that even a 26% jump only took the VIX to 14.68, still within the normal band. That detail matters: it says the crash was a sharp shock, but not yet a full-blown panic. For context, during the 2020 Covid crash the India VIX soared above 80, a level of fear an order of magnitude beyond this week's.
Why it moves with the market
The India VIX usually moves in the opposite direction to the Nifty. When stocks fall hard, fear and demand for protection rise together, so the VIX jumps, and when stocks climb calmly, the VIX fades. That inverse relationship is why traders watch it as a sentiment thermometer alongside the index itself, a habit that fits naturally with tracking the Indian stock market today.
The July spike had several ingredients beyond the crash: the US-Iran escalation, crude oil jumping above $79, a weaker rupee, and the start of the Q1 FY27 earnings season, all covered in our stock market crash today wrap. Each added a layer of uncertainty, and the VIX simply summed them into one number.
The mechanics behind the number are worth knowing, because they explain its limits. India VIX is computed from the order book of near-month and next-month Nifty option contracts, using the best bid and ask prices rather than the last traded price, which keeps it from being distorted by a single stale trade.
That construction also means it is backward-looking in one specific sense. The VIX reflects what option sellers are charging right now for protection over the next 30 days, not a forecast of what will actually happen, so it rises fastest after a shock rather than before one. A calm VIX has never prevented a crash and has often preceded one.
For an investor, the practical use is modest but real. A low VIX warns that the market may be too complacent, while a rising VIX flags that bigger swings are expected, useful for sizing risk or deciding whether to hedge. What it never does is tell you the direction, which is the mistake people make when they treat a VIX spike as a signal to sell. The fear gauge measures the weather, not the destination, and reading it that way is the difference between using it well and misusing it.